Data-driven digital PR means generating original data, proprietary numbers, survey findings, a fresh cut of public data, and turning it into a story worth covering. Not opinions or product news, but a specific, verifiable number nobody’s published yet.
That’s what makes it work for two audiences at once. Journalists want a fact nobody else has reported. AI models favor sources that state a clear figure and show their methodology. A good data story earns both a link today and a citation long after.
The data-driven digital PR process has three parts: finding data that supports a newsworthy story, shaping it into a compelling angle, and packaging it with enough evidence and methodology to withstand scrutiny.
What Data-Driven Digital PR Actually Means Here
Most data-driven digital PR advice assumes you already have something worth citing. This starts a step earlier, finding or generating the data, shaping it into a story, and getting it in front of the people and models who’ll cite it.
How This Differs From the Statistics-Pages Motion
A statistics page is passive: built once, cited whenever someone searches “average X” or “Y statistics 2026.” It collects facts that already exist. This is actively generating an original data point that nobody has published before. Creating the fact, not just hosting it.
How This Differs From Outreach-Only Digital PR for AI Citations
Outreach-only digital PR assumes the asset already exists; you’re pitching what’s built. This starts earlier: finding the data, shaping the angle, packaging it as citation-ready. Outreach builds on this.
Why This Motion Earns Both Journalist Links and AI-Model Citations
Journalists and AI models reward the same things: novelty and verifiability. A journalist wants an unreported number from a credible source. An AI model favors sources that state a figure clearly and show their methodology.
An invoicing SaaS company sitting on untouched, anonymized payment timing data exactly the raw material this motion turns into a story and a lasting citation.
How to Find a Data Story Worth Pitching
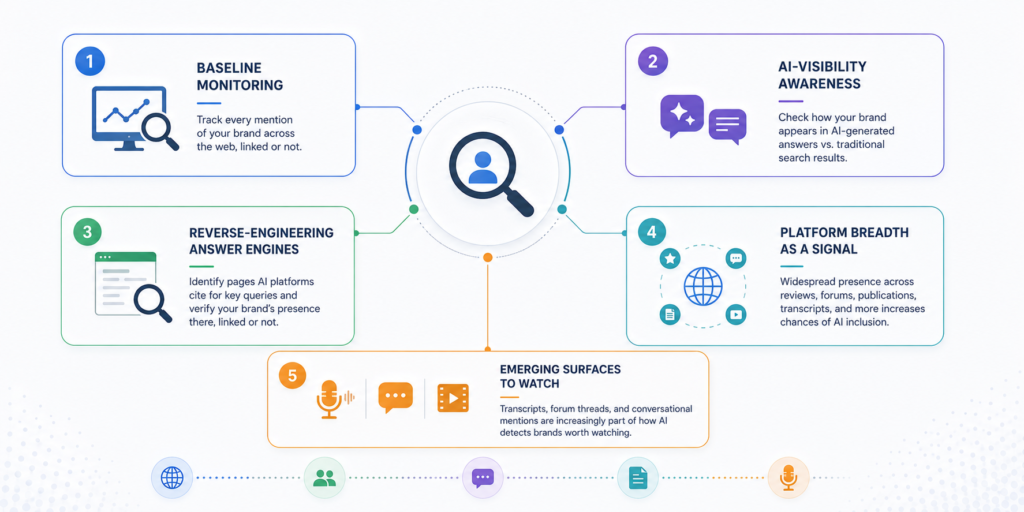
Successful data-driven digital PR campaigns begin with finding a story that journalists actually want to cover. A pitchable data story comes down to three questions: where the data comes from, whether it matters beyond your company, and when to release it. Here’s how to work through all three.
Where to Source Original Data
Original data comes from a handful of places: proprietary usage data you already collect, original surveys, public datasets remixed in a new way, or aggregated data from multiple sources. The best starting point is usually data you already have but haven’t published.
The “So What” Filter
Not every dataset is a story. Ask what a stranger with no context would do with this number; if the answer is “shrug,” it fails the filter, however interesting it is internally.
An invoicing SaaS company, sits on years of anonymized payment timing data. “Which industries pay latest” clears the filter, specific, surprising, headline-ready. “Average invoice size” isn’t accurate, but nobody outside the company cares.
Timing Data to News Cycles, Seasons, and Trends
The same finding lands differently depending on when you release it. Late-payment data matters more heading into tax season than on a random week. Before pitching, check for a calendar moment or news cycle the data can ride; timing often decides whether a solid story gets picked up.
How to Turn Raw Data Into a Pitchable Angle
Raw data doesn’t pitch itself; it has to be cut into an angle, stress-tested as a headline, and built to satisfy both journalists and AI systems. Here’s how.
One Dataset, Multiple Angles
A dataset rarely has just one story. Cut it a few ways: overall vs. by segment, this year vs. last year, and look for the outlier that breaks the pattern. Each cut is a different pitch, aimed at different coverage.
Headline-Testing the Finding
Write the headline before building anything. If it won’t compress into one clickable sentence, the angle isn’t ready to cut the data differently.
Using InvoicePilot’s payment-timing data, one dataset splits into three angles:
| Angle | Headline Test | Verdict |
| Latest-paying industry, nationally | “Which Industry Pays Its Bills Latest?” | Passes specific, surprising, one clear number |
| YoY change since rate hikes | “Late Payments Are Rising Across Every Industry” | Passes ties to a live economic narrative |
| The one industry that got faster | “While Everyone Pays Later, This Industry Sped Up” | Passes, but narrower is better as a follow-up |
The first wins on breadth, the second on timeliness, both strong enough to lead with, depending on the news cycle.
Journalist vs. AI Citation Criteria Overlap and Divergence
Both want specificity, surprise, and a source that holds up but diverge in what they do with it. Journalists pull toward the human hook: which industry, why, what it means for a business owner. AI models pull toward the most extractable claim: the exact figure, stated plainly enough to lift into an answer.
The strongest angles satisfy both: a clear number wrapped in a narrative worth reading. The headline above carries the hook; the underlying stat “industry X takes Y days longer to pay” stands alone in an AI-generated answer.
Packaging a Data Asset So It Gets Cited
Getting cited takes more than a good number; it takes packaging that both humans and machines can trust and pass along: transparent methodology, extractable stats, shareable visuals, and crawler-friendly markup. Here’s how each works, using InvoicePilot as a running example.
Methodology Transparency and AI Trust
Methodology transparency sample size, date range, how the data was collected is one of the clearest trust signals a source can give. A number without a visible source is easy to doubt and hard to cite confidently, whether the reader is a journalist or an AI system deciding what to surface.
Structuring for Extractable Stats
A stat buried in a paragraph rarely gets lifted cleanly. Let the number stand on its own: a short claim plus one sentence of context rather than embedding it deep in prose. If it can’t be copied out cleanly, it won’t be cited cleanly.
Visualization Choices That Get Re-Cited
Simple charts get embedded and shared; busy ones don’t. A single bar chart or ranked list gets screenshotted and re-cited across articles. Dense, multi-layered visuals tend to just get described in words, if referenced at all.
Structured Data and Schema for Crawlers
Beyond how a page reads to a person, it needs to be legible to crawlers. Schema markup helps search engines and AI systems parse what the stat is, where it’s from, and when it was published, increasing the odds it’s pulled accurately rather than paraphrased or ignored.
In practice, using InvoicePilot as an example:
- Methodology: Based on anonymized data from 40,000+ invoices processed on the InvoicePilot platform, January 2024–December 2025.
- Stat: Construction companies take an average of 52 days to pay invoices, 18 days longer than the cross-industry average of 34 days.
A short methodology block plus a clean, standalone stat: easy for a journalist to quote, easy for an AI system to extract.
How to Pitch Data Stories to Journalists
Finding a data story worth pitching comes down to three questions, in order: where does the data come from, does it actually matter to anyone outside your company, and when should it go out. Skip any one of them and even good data ends up ignored. Here’s how to work through all three.
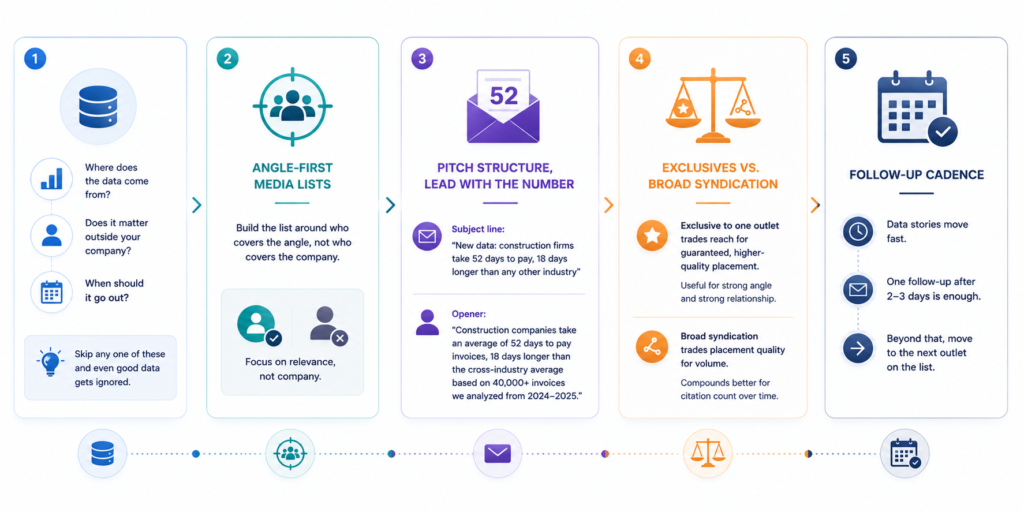
Angle-First Media Lists
Build the list around who covers the angle, not who covers the company. A finance reporter interested in small-business cash flow is a better fit than a generic tech reporter, even if the data came from a tech company.
Pitch Structure, Lead With the Number
Open with the stat, not the brand. A journalist deciding in five seconds whether to open an email responds to a number, not a company name.
Subject line: “New data: construction firms take 52 days to pay, 18 days longer than any other industry”
Opener: “Construction companies take an average of 52 days to pay invoices, 18 days longer than the cross-industry average based on 40,000+ invoices we analyzed from 2024–2025.”
Exclusives vs. Broad Syndication
An exclusive to one outlet trades reach for guaranteed, higher-quality placement useful for a strong angle and a strong relationship. Broad syndication trades placement quality for volume, which compounds better for citation count over time.
Follow-Up Cadence
Data stories move fast; a journalist deciding today won’t still be deciding next week. One follow-up after 2–3 days is enough; beyond that, move to the next outlet on the list.
Turning Coverage Into Durable Citations
Getting coverage is only the first step; what happens after determines whether it keeps paying off. That means chasing down mentions that don’t link back, tracking how far a placement spreads once it’s picked up elsewhere, and making sure your original page stays the definitive source as coverage multiplies. Here’s how to do all three.
Link Reclamation
Not every mention comes with a link. When a story cites your data without linking back, ask for one; an unlinked mention isn’t doing its job yet.
Tracking Syndication
Flagged for fact-check before publishing.
A single placement often gets republished across multiple outlets. Tracking where it spreads shows the real reach of a campaign, often far beyond the original placement.
Keeping the Source Page Canonical
As coverage spreads, keep your original page the one that gets cited, not a syndicated copy. Clear “original research” framing and periodic data updates keep it the freshest, most authoritative version to point to.
Feeding AI Citation Loops
Getting picked up is only half the job; the page also needs to be crawlable, so AI systems can find it independently. Once live, monitor which AI answers cite it as a signal for what to publish next.
Using InvoicePilot: one placement in a trade publication syndicates to several outlets. Because the original page states its methodology clearly and stays updated, it remains the version both journalists and AI systems keep citing back to, not the copies.
How to Measure Data-Driven PR Results
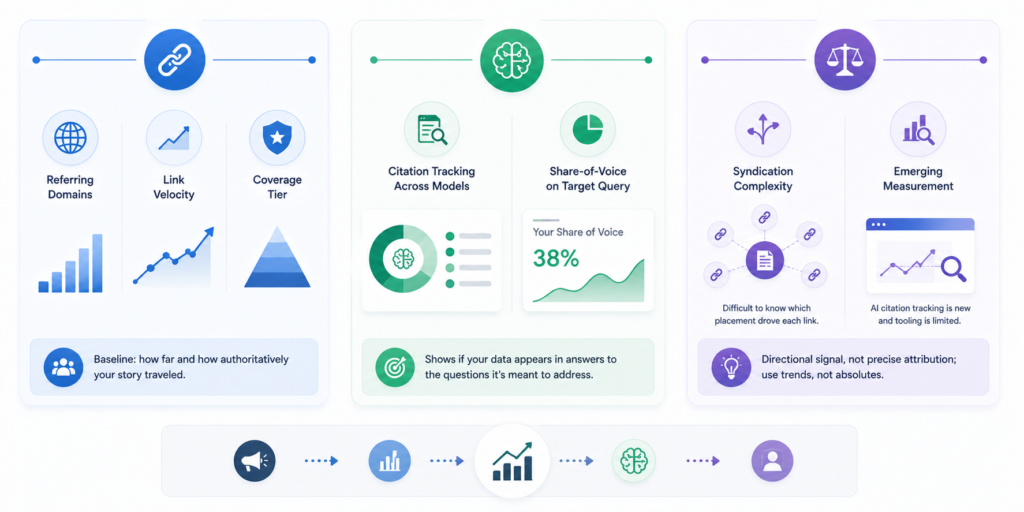
Traditional PR Metrics
Referring domains, link velocity, and coverage tier: how many sites linked, how fast, and how authoritative they are. These remain the baseline measures of how far a story traveled.
AI-Specific Metrics
Citation tracking across models and share-of-voice on the query your data answers. These show whether the page is being surfaced when someone asks the question your stat addresses, independent of traditional links.
Attribution Difficulty
Both sets of metrics are directional, not exact. Syndication muddies which placement drove a link, and AI citation tracking is still an emerging practice with limited tooling; treat the numbers as signal, not precise attribution.
Common Mistakes That Kill a Data PR Campaign
- Data too internal or unverifiable. If the data can’t hold up to a journalist’s or a fact-checker’s questions about where it came from, it won’t get covered or cited.
- Good data, no angle. A solid dataset with no clear “so what” never gets picked up; interesting internally isn’t the same as newsworthy.
- Angle without methodology. A strong headline gets one placement, then dies without visible methodology; nobody can verify or re-cite it afterward.
- Treating it as one-and-done. A single release fades fast. Without an update cadence, the page stops being the freshest source and stops getting cited.
Close: The Flywheel
Coverage is the visible payoff, but it’s not the last step. The real return comes from what you do with the data point after the news cycle moves on; and that’s where it connects back to the rest of your content ecosystem.
How This Feeds the Evergreen Statistics-Pages Asset
The work doesn’t stop once the coverage rolls in. Once a data point has been reported and cited, the natural next step is to give it a permanent home: an entry on your own statistics page, where it keeps earning search and AI traffic long after the story itself has faded from the news cycle.
Take InvoicePilot’s “52 days to pay” stat. After it’s been pitched, picked up, and cited a few times, it doesn’t just disappear; it becomes one line on their stats page, sitting alongside whatever they publish next. That’s really the whole point of this motion: every campaign you run doesn’t just earn coverage once; it leaves behind something that keeps earning long after.
