Every day, thousands of articles repeat the same facts and statistics from existing sources. While this content can still be useful, it rarely becomes the source that others reference. Original data and statistics pages stand out because they contribute something new instead of repeating information that already exists.
Whether it’s a survey, benchmark report, customer insights, or research findings, original data gives readers and AI a reliable source to reference. When the information is unique, transparent, and well-organized, it has a much better chance of earning citations than content built only from existing sources.
This article explains why original research is cited more often, the types of data you can publish, how to collect reliable information, ways to present findings clearly, common mistakes to avoid, and how original data can strengthen your digital PR efforts.
Why Original Data Earns More AI Citations
AI aims to provide answers based on the most reliable information available. When multiple websites repeat the same statistic, AI often looks for the original source rather than the pages that copied it. That’s why original data and statistics pages are more likely to earn citations; they provide firsthand evidence instead of repeating existing information.
Original research also makes it easier to verify where the information came from. If you clearly explain how the data was collected and present the findings in a transparent way, your page becomes a stronger reference for both readers and AI.
The U.S. Bureau of Labor Statistics (BLS) publishes original employment and economic data that is widely cited by researchers, journalists, policymakers, and public institutions. Many reports reference BLS statistics because they are the primary source rather than a secondary interpretation.
Types of Original Data You Can Publish
You don’t need to conduct a large research project to create original data. Even small, well-documented datasets can provide unique insights if they are collected and presented clearly. The key is to publish information that isn’t simply copied from another source.
Some common types of original data include:
- Surveys
Collect responses from a specific audience to understand opinions, behaviors, or preferences.
- Industry Benchmarks
Compare performance metrics across companies, products, or processes to establish a reference point.
- Internal Company Data
Analyze data generated by your own business, such as customer trends, product usage, or support requests.
- Market Research
Study a particular market, audience, or industry to identify patterns and emerging trends.
- Case Study Data
Share measurable results from a real project or experiment, supported by clear methodology.
- Trend Reports
Track changes over time using data collected across months or years to highlight meaningful shifts.
- Customer Insights
Use feedback, reviews, or behavioral data to uncover patterns that help explain customer needs or decisions.
How to Collect Reliable Data
The quality of your research depends on how the data is collected. A clear and consistent process makes your findings more trustworthy and easier for others to reference.
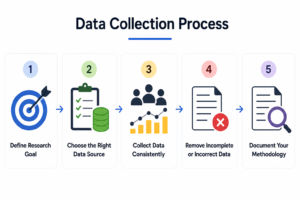
Define Your Research Goal
Start with a clear question. Knowing exactly what you want to measure helps you collect relevant data.
Choose the Right Data Source
Gather information from a reliable source, whether it’s a survey, internal records, public datasets, or direct observations.
Collect Data Consistently
Use the same method for every response or data point to keep the results accurate and unbiased.
Remove Incomplete or Incorrect Data
Review your dataset and exclude duplicate entries, incomplete responses, or obvious errors before analyzing the results.
Document Your Methodology
Explain how the data was collected, the sample size, the time period, and any limitations. A transparent methodology helps readers understand and trust your findings.
Turning Raw Data Into Citation-Worthy Insights
Collecting data is only the first step. To make your research valuable, you need to turn raw numbers into insights that are easy to understand and useful for readers. Clear explanations also make it easier for AI to identify the most important findings.
- Identify meaningful patterns: Look for trends, recurring behaviors, or noticeable changes instead of focusing on individual numbers.
- Compare your findings: Show how the results differ across time periods, locations, age groups, industries, or other relevant categories to add context.
- Highlight the key statistics: Emphasize the most important numbers that directly answer your research question instead of presenting every data point equally.
- Explain what the data means: Help readers understand why a statistic is important and what it reveals about the topic.
- Support every conclusion with evidence: Make sure your insights are backed by the collected data rather than assumptions or personal opinions.
- Be transparent about limitations: Mention factors such as sample size, data collection period, or possible biases so readers can interpret the results accurately.
- Summarize the main takeaway: End each section with a short conclusion that reinforces the most important insight from the data.
Structuring Statistics Pages for Easy Extraction
A well-organized statistics page makes it easier for readers to find information and for AI to identify important facts. Clear formatting helps key data stand out instead of getting buried in long paragraphs.
- Start with a direct summary that highlights the most important finding.
- Use descriptive headings so each section covers one specific topic.
- Present statistics in tables when comparing multiple values or categories.
- Include charts or graphs to visualize trends, followed by a short explanation of what they show.
- Use bullet points to highlight key findings and make important numbers easier to scan.
- Add a methodology section explaining how the data was collected, the sample size, and the research period.
- Cite the original source if your page includes external data alongside your own research.
Example
Instead of writing:
“The survey included 2,500 participants and several interesting trends were identified across different age groups.”
Write:
Key Finding
- 2,500 participants completed the survey.
- 62% preferred online learning over classroom training.
- Ages 18–34 showed the highest participation rate.
- Survey period: January–March 2026.
This format makes important information easier to scan, understand, and extract.
Common Mistakes That Make Data Less Citable
Even valuable research can lose credibility if important details are missing. The following mistakes make it harder for readers and AI to understand, verify, and reference your data.
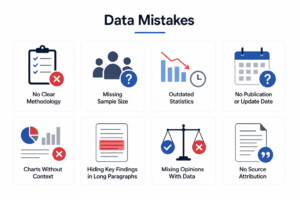
No Clear Methodology
Publishing results without explaining how the data was collected makes it difficult to judge its reliability.
Missing Sample Size
Without knowing how many people, records, or observations were included, readers cannot evaluate the strength of the findings.
Outdated Statistics
Old data can become misleading over time. Review and update statistics regularly to keep them relevant.
No Publication or Update Date
Readers need to know when the research was published and whether the data is still current.
Charts Without Context
Visuals should always include labels and a short explanation. A chart alone doesn’t explain what the numbers mean.
Hiding Key Findings in Long Paragraphs
Important statistics are easier to understand when they are presented in tables, bullet points, or short summaries.
Mixing Opinions With Data
Separate factual findings from personal interpretations. Let the data support your conclusions.
No Source Attribution
If your research includes external data, always credit the original source to maintain transparency and credibility.
Publishing a High-Quality Statistics Page (Checklist)
Before publishing your research, review your page to make sure it is complete, accurate, and easy to understand.
- Define a clear research objective.
- Use a reliable data collection method.
- Include the sample size and research period.
- Explain your methodology.
- Present key findings using tables, charts, or bullet points.
- Add context to explain what the results mean.
- Include publication and last updated dates.
- Cite all external sources.
- Review the data for accuracy before publishing.
Example
Imagine you conduct a survey asking 500 university students about their preferred study methods. Instead of only stating that 68% prefer digital notes, make the page more useful by including:
- The purpose of the survey.
- Who participated.
- When the survey was conducted.
- How responses were collected.
- A chart or table showing the results.
- A short explanation of what the findings suggest.
Providing this context makes the research easier to understand, verify, and reference than simply publishing a single percentage.
Connecting Original Data to Your Digital PR Strategy
Original data can continue creating value long after it’s published. Instead of keeping your research on a single page, you can use it to support your digital PR efforts and reach a wider audience.
- Share your findings with journalists, industry publications, and bloggers looking for reliable statistics.
- Turn key insights into infographics, social media posts, or press releases.
- Reference your research in related blog posts to strengthen internal linking.
- Update your statistics page regularly as new data becomes available.
- Link your research from relevant content so readers can easily access the original source.
When your data is unique, well-documented, and easy to understand, it becomes a resource that others are more likely to reference. This not only increases visibility but also helps establish your website as a trusted source of original information.
FAQs
1. Can original data improve content authority?
Yes, Original data gives your content unique value and can establish your website as a reliable source of information.
2. Do AI systems prefer recent statistics?
Yes, More recent data is generally more useful, especially for topics that change over time.
3. Can small research projects still be valuable?
Yes, A well-planned survey or dataset can provide useful insights even if it is smaller in scale.
4. Should I update my statistics page regularly?
Yes, Keeping your data current helps maintain its accuracy and usefulness.
5. Is it acceptable to combine original and external data?
Yes, You can include both, as long as external statistics are properly cited and clearly distinguished from your own research.
Conclusion
Original data gives your content something that copied statistics cannot. When your research is collected carefully, presented clearly, and supported with transparent methodology, it becomes a reliable resource for both readers and AI.
Creating original data takes more effort than summarizing existing information, but it also creates more opportunities to earn citations, attract references, and build long-term authority. The more useful and trustworthy your research is, the more likely it is to be cited as the original source.
