The combined SEO and AEO dashboard is a single Looker Studio report that unifies organic search data from GA4 and Google Search Console with AI visibility data such as citations, prompt coverage, and AI Overview appearances. Allowing AI visibility data to sit in a separate spreadsheet only tells half the story. A shared dashboard proves the connection between organic performance and AI citations. Both checks matter for AI visibility reporting.
In this guide, you will learn why SEO and AI visibility need one shared dashboard, what data sources and access you need before starting, how to connect GA4, Search Console, and an AI visibility export step by step, which four panels are worth building, why clicks and citations should never be merged into one metric, and which common mistakes to avoid when maintaining the dashboard.
Why Do You Need SEO and AEO in One View?
Separate reporting creates a blind spot. A GA4 dashboard tracks sessions and conversions. A separate AI visibility tracker, if one exists at all, tracks whether content appears in ChatGPT, Perplexity, or Google AI Overviews. When these live apart, nobody sees the full cause and effect behind a traffic change.
The Blind Spot in Separate Reporting
A page can lose organic clicks while gaining AI citations, or the reverse. A split report never surfaces that pattern. Combined reporting connects the two data sets so the cause becomes visible.
Who This Dashboard Is For
This dashboard serves analysts, agency reporting teams, and content ops staff who explain performance across both channels. It removes the need to switch between five separate tools for one weekly report.
What Will You Need Before You Start?
Three data sources power this dashboard: GA4, Google Search Console, and an AI visibility export. Gather access to all three before opening Looker Studio.
Data Sources You’ll Connect
GA4 supplies session and conversion data. Google Search Console supplies clicks, impressions, and average position. The AI visibility export supplies citation and prompt coverage data, and it should include the tracked prompt, the date, citation status, and the source URL when available.
Access Requirements
GA4 requires at least Viewer access to the property. Search Console requires a verified property, either domain level or URL prefix. The AI visibility data requires a CSV file or a connected Google Sheet, since Looker Studio has no native connector for AI citation tracking tools yet.
Setting Up Looker Studio
Open a blank Looker Studio report once access to all three sources is confirmed. The report is ready for data connections at this point.
How Do You Connect Your Data Sources Step by Step?
Four steps connect GA4, Search Console, and the AI visibility export into one report. Each step adds one data source or one structural decision.
Step 1: Connect GA4
Click Add Data in Looker Studio, select the Google Analytics connector, and choose the GA4 property. Pull in sessions, engaged sessions, and organic channel data at minimum.
Step 2: Connect Google Search Console
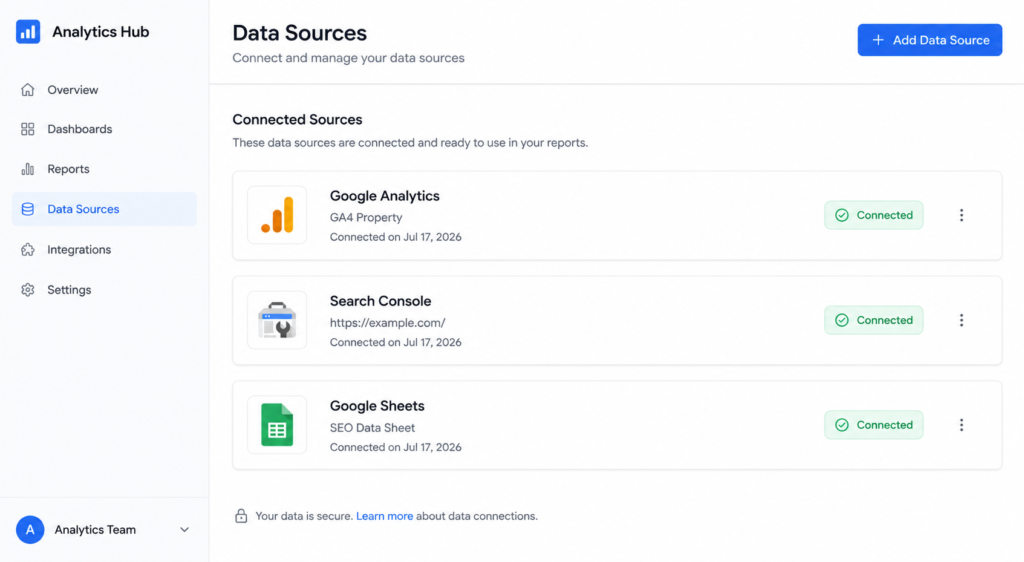
Add a second data source using the Search Console connector. Choose the URL table for page-level detail or the Site Impression table for query-level detail. Clicks, impressions, CTR, and average position are the core fields.
Step 3: Import the AI Visibility Export
Add the CSV or connected Google Sheet as a third data source. A connected Google Sheet refreshes automatically, while a static CSV upload does not, so the Sheet is the better option for recurring reports.
Step 4: Blend or Keep Sources Separate
Looker Studio blends data sources into a single table when they share a common key, such as URL or date. Keep GA4, Search Console, and the AI visibility export as separate sources feeding separate panels in most cases. Blend them only when a genuine shared key exists, such as a content URL present in both the Search Console data and the AI visibility export.
Which Dashboard Panels Actually Matter?
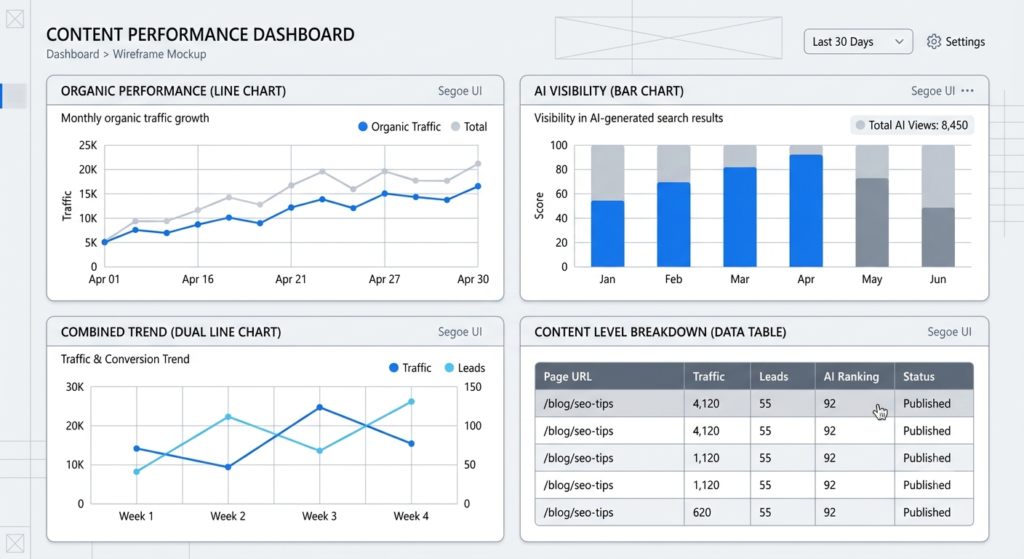
Four panel types cover the core reporting need: organic performance, AI visibility, combined trend, and content level breakdown. Building around these four avoids an overcrowded, single-page report.
Organic Performance Panel
GA4 organic sessions, Search Console clicks and impressions, and average position over time form the baseline SEO health check.
AI Visibility Panel
Total citation count, the number of tracked prompts with coverage, and share of voice by topic form the AI visibility baseline.
Combined Trend Panel
Organic sessions and AI citation count appear as two separate lines on the same timeline. This layout shows correlation without implying the two metrics measure the same thing.
Content Level Breakdown Table
One row per URL or topic shows organic clicks, average position, and AI citation status side by side. Content teams use this table to decide which pages to update next.
Why Shouldn’t You Conflate Click Data with Citation Data?
Clicks and citations measure different user behaviors, and merging them into one number misleads the reader. This distinction deserves its own section rather than a footnote.
Why These Metrics Are Not the Same
GA4 and Search Console measure clicks, meaning a user actively chose to visit the page from a search result. AI visibility tools measure citations, meaning an AI model referenced the content inside a generated answer, an action the user may never see or click through to verify.
How to Present Both Without a False Equivalence
Two scorecards work better than one combined score. Dual axis charts with distinct labels work better than a single merged metric. A combined “visibility index” should only appear when a documented weighted model backs the number.
Framing This for Stakeholders
A rise in AI citations does not guarantee a rise in organic clicks. A drop in rankings does not guarantee a drop in AI visibility. State this plainly whenever the dashboard reaches a stakeholder audience.
How Should You Structure the Report for Non-Technical Stakeholders?
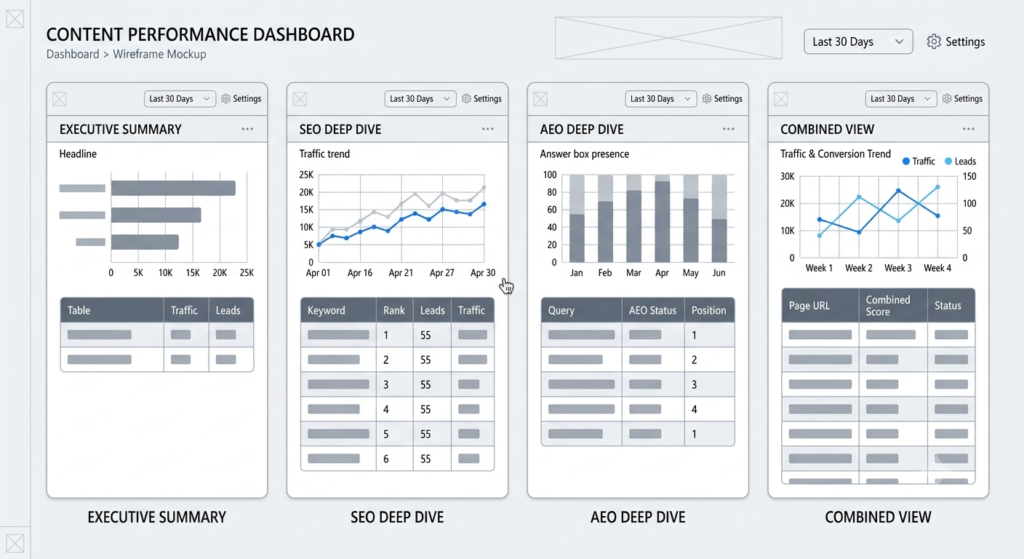
Four pages keep the report readable: an executive summary, an SEO deep dive, an AEO deep dive, and a combined view. Splitting the report this way prevents any single page from becoming overwhelming.
- Page 1: Executive Summary
Scorecards cover total organic sessions, total clicks, total AI citations, and the period over period change for each metric.
- Page 2: SEO Deep Dive
GA4 and Search Console panels cover top pages, top queries, and average position trends.
- Page 3: AEO Deep Dive
AI visibility panels cover winning prompts, losing prompts, and citation trends by topic.
- Page 4: Combined Trend and Content Table
The side-by-side trend chart and the content level breakdown table appear together on this page.
What Common Mistakes Should You Avoid?
Three mistakes break most combined dashboards: forced blending, merged metrics, and stale exports. Each one is avoidable with the right setup.
Blending Data Without a Shared Key
A blend without a matching URL or date field between the AI export and GA4 or Search Console produces broken or misleading joins.
Treating Citations as Equivalent to Clicks
A stacked bar chart that adds citations and clicks into one total misleads any stakeholder who asks what the number represents.
Skipping Refresh Schedules
A manually uploaded CSV goes stale fast. A recurring calendar reminder or a scheduled update inside a connected Google Sheet prevents this.
What Are the Pro Tips for Maintaining the Dashboard?
Automation, consistent naming, and correct permissions keep the dashboard reliable over time.
Automate the Refresh
A scheduled script that writes to a connected Google Sheet automates the AI visibility export refresh wherever the tracking tool allows it.
Keep Naming Conventions Consistent
Consistent naming for URLs, dates, and topics across all three sources prevents the most common cause of broken blended data sources.
Set Sharing Permissions Correctly
View access, rather than edit access, protects the dashboard from accidental filter changes once stakeholders start viewing it regularly.
Conclusion and Next Steps
A combined SEO and AEO dashboard does not need to merge every metric into one number. It needs both channels in front of the same audience, on the same page, with honest labeling for each metric. Start with the four core panels above, connect the three data sources carefully, and keep the click versus citation caveat visible on every page that shows both.
For deeper coverage of the individual data sources, see the guide on tracking AI referral traffic in GA4 and the GA4 versus Google Search Console explainer for a closer look at what each platform measures.
FAQs
-
Is there a native Looker Studio connector for AI visibility tools?
No native connector exists yet for AI citation tracking tools. A CSV upload or a connected Google Sheet is the current workaround.
-
How often should the AI visibility data be refreshed?
Weekly refresh works for most teams tracking prompt coverage. Faster-moving industries or active brand campaigns may need daily updates.
-
Can this dashboard be used for client reporting in an agency setting?
Yes, the four-page structure suits client-facing reports well. View-only access keeps clients from editing filters or panels.
-
Does Looker Studio support real-time AI citation data?
No, Looker Studio only reflects data as recently as the connected source updates. Real-time tracking depends entirely on the AI visibility tool’s own refresh schedule.
-
What if my AI visibility tool does not export a URL field?
Tracking by topic or brand name works as a substitute for URL level tracking. Skip the blended content table panel and report AI visibility as a standalone section instead.

Faijan waris
Hi, I'm Faijan, a passionate SEO and content strategist at RankingBite. I specialize in creating high-quality, SEO-optimized content that not only ranks on search engines but also resonates with readers. From compelling blog posts to engaging web copy, I craft every piece of content with purpose and precision. My goal is simple: to help brands tell their story, connect with their audience, and grow their digital presence through the power of words.